
Surface Plasmon Resonance Peptide Binding Research

Last updated: October 2026
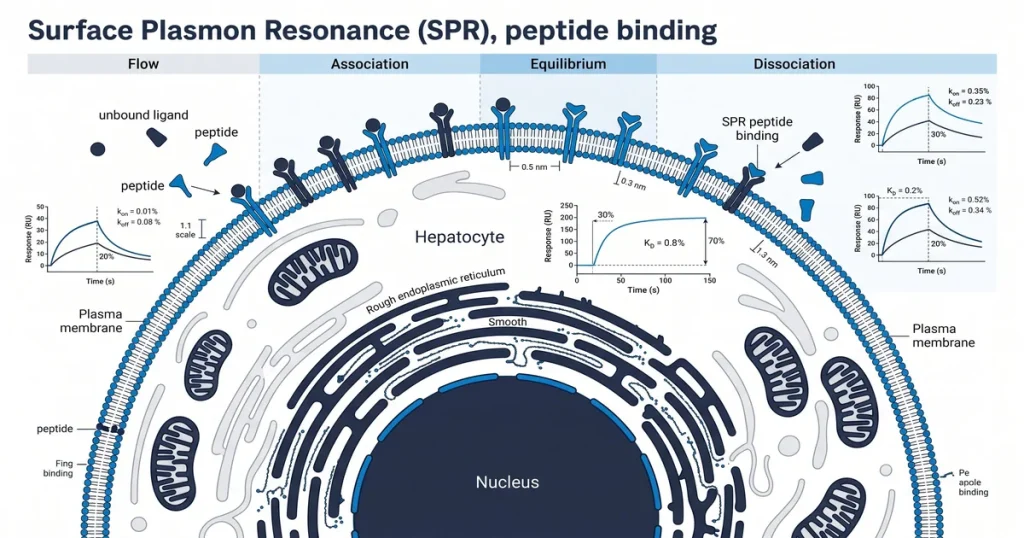
A surface plasmon resonance (SPR) detector is a label-free lab tool that measures peptide binding in real time. No dye or tracer labels are added to either molecule during the assay. A thin gold sensor chip tracks mass changes as a peptide binds its target, and the refractive index shift records each event.
Next Level Pharm supplies research-grade peptides to labs across the USA. Every batch is tested by HPLC (high-performance liquid chromatography) and mass spectrometry.
Full testing details are at the about page. Each compound ships as a lyophilized (freeze-dried) powder with a lot-specific COA (certificate of analysis).
Proper chip setup and model fitting are both needed for valid data. SPR belongs to a group of label-free binding methods. This group also includes ITC (isothermal titration calorimetry) and BLI (biolayer interferometry). SPR gives both kinetic and affinity data in one run.
Key Takeaways
- Label-Free Detection: SPR tracks mass changes through optical shifts. No dye or tracer tags are added to either molecule.
- Three Core Parameters: SPR outputs ka (binding rate), kd (release rate), and KD (affinity constant). Lower KD values mean a tighter bond.
- Sensor Chip Setup: Stable ligand attachment on the chip is the most critical step. Poor attachment leads to weak signal and bad data.
- Sensorgram Output: The instrument plots response units (RU) over time on a sensorgram. A rising RU shows binding; a falling RU shows release.
- Model Fitting: Analysts apply the 1:1 Langmuir model to raw sensorgram curves. A low chi-sq value confirms a valid fit.
Each section below covers one part of the SPR workflow for peptide binding research.
What is surface plasmon resonance (SPR)?
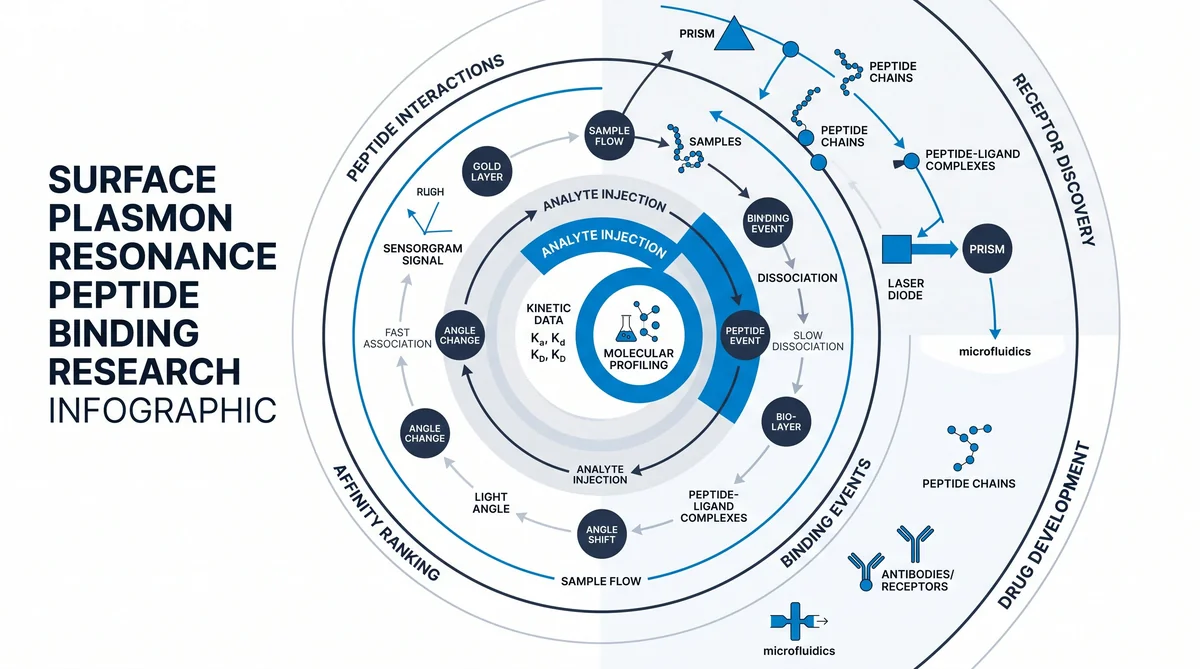
An SPR detector tracks refractive index shifts at a gold-coated sensor chip. Polarized light enters the chip through a prism at a set angle. As molecules attach to the chip, mass builds up and the resonance angle shifts.
The instrument records each shift as response units (RU) in real time. The sensor chip has a glass base coated with a thin gold film. A dextran matrix on the film holds the target molecule in place.
Light at the metal-glass interface creates surface plasmons (electron waves along the metal). Any mass change alters these waves. According to PubMed (2018), this label-free format is widely used in peptide binding studies.
Neither molecule needs its structure changed for the assay.
How does SPR measure peptide binding kinetics?
SPR measures kinetics by fixing one molecule (the ligand) on the chip. The peptide analyte then flows over it. As binding occurs, mass increases and the RU signal rises.
When analyte flow stops, the peptide leaves the surface and the RU signal falls. Each run gives both binding and release data in one cycle. Researchers run cycles at several analyte levels to build a binding profile.
According to MDPI Molecules (2021), this approach allows direct calculation of rate constants. No labels or detection tags are needed.
What are the key kinetic parameters in SPR?
The three key outputs from SPR are ka, kd, and KD. The binding rate constant (ka) measures how fast the peptide binds its target. The release rate constant (kd) measures how fast the complex breaks apart.
The affinity constant (KD) equals kd divided by ka. A lower KD means a stronger bond. Binding in the nanomolar (nM) or picomolar (pM) range shows high affinity.
According to PubMed (2024), accurate kinetic profiling supports target validation in peptide research programs.
Research-grade peptides for SPR studies are available at Next Level Pharm. Every vial ships with COA data and full lot records.
How are peptides prepared for SPR analysis?
Peptides are prepared by attaching the ligand to the chip through chemical coupling. The most common method is amine coupling. It links amine groups on the peptide to carboxyl groups on the chip dextran matrix.
Consistent attachment is required before injections begin.
Other methods include thiol coupling for cysteine-rich peptides and the biotin-streptavidin system for tagged constructs. The biotin-streptavidin system offers very strong attachment and limits surface loss during wash cycles. Researchers also check ligand orientation because a blocked binding site reduces signal quality.
Impurities can co-attach and create false binding signals. High-purity materials for recovery peptide studies are at the recovery peptides catalog.
How is SPR sensorgram data analyzed?
SPR sensorgram data is analyzed by fitting binding curves to a model. The 1:1 Langmuir model is the standard for simple one-to-one events. Analysts apply global fitting across all analyte levels to extract ka and kd.
The chi-sq value and residual plot confirm whether the model fits the data. Steady-state analysis plots the plateau RU value against analyte level to derive KD. Double-referencing removes drift and noise from the final result.
What are common limitations of SPR assays?
Common SPR limitations include mass transport limitation, non-specific binding, and surface wash failure. Mass transport limitation occurs when the flow rate is too slow. The signal then reflects delivery speed rather than true binding kinetics.
Non-specific binding adds noise that inflates the RU signal. Surface wash cycles can degrade the chip over time. A harsh wash buffer strips the ligand from the matrix, while a mild one leaves residual analyte.
Researchers can browse the fitness and GH peptide catalog for HPLC-verified and mass spec-verified materials.
How does SPR compare to other binding methods?
SPR gives real-time kinetics without labels at low sample volume. ITC gives heat data (enthalpy, entropy) but needs far more sample. BLI is faster for plate screening but gives less detail at low analyte levels.
ELISA needs labels and gives only endpoint data with no kinetics. SPR is the only method in this group that gives both real-time rates and label-free detection.
| Method | Labels Required | Real-Time Kinetics | KD Range | Sample Volume |
|---|---|---|---|---|
| SPR | No | Yes | pM to microM | 50-200 microL |
| ITC | No | No | nM to mM | 1-2 mL |
| BLI | No | Yes | pM to microM | 200 microL |
| Fluorescence Polarization | Yes | Limited | nM to microM | 10-100 microL |
| ELISA | Yes | No | pM to nM | Variable |
Frequently Asked Questions
What is the surface plasmon resonance measurement principle?
SPR detects binding by tracking refractive index changes at a gold film. Polarized light hits the metal at a set angle and drives electron waves along the surface. As molecules bind, local mass increases and shifts this resonance angle.
The instrument records each shift as a response unit (RU) value. This optical method gives a label-free binding signal in real time. No tags are added to either molecule.
How is a peptide immobilized on an SPR sensor chip?
Peptides are attached to the chip through chemical coupling such as amine coupling or tagging. Amine coupling activates the dextran surface with EDC and NHS to create bond sites. The peptide ligand then flows over the surface and forms stable covalent bonds.
For tagged peptides, the biotin-streptavidin system provides very strong non-covalent attachment. According to MDPI Molecules (2021), correct orientation after attachment keeps active binding sites exposed to the analyte.
What kinetic parameters does SPR measure for peptide binding?
SPR measures three parameters: the binding rate constant (ka), release rate constant (kd), and KD. The ka describes how fast the peptide-target complex forms. The kd describes how fast the complex breaks apart.
The KD, equal to the ratio of kd to ka, gives the overall binding affinity score. Lower KD values show a stronger bond between the peptide and its target.
How is SPR data analyzed for binding affinity calculations?
Analysts fit sensorgram data to models, such as the 1:1 Langmuir model, to derive rate constants. Software compares observed binding curves against model curves to find the closest fit. Researchers check residuals to confirm the model reflects the physical interaction.
The steady-state method plots plateau RU values against analyte level to derive KD. According to doi.org (2023), this allows precise affinity measurement without added detection steps.
What controls are required in peptide SPR experiments?
SPR experiments need a reference channel to subtract non-specific binding from the active signal. This channel has the dextran matrix but no immobilized ligand. Scientists also run buffer-only injections to correct for baseline drift.
Subtracting both the reference channel and buffer-only signals from sample data is called double-referencing. This step ensures the final sensorgram reflects only the binding event between the peptide and its target.
What are the advantages of SPR over other binding assays?
SPR offers real-time kinetic rates, which endpoint assays cannot provide. It is label-free, so no tags are added that might change binding behavior. The ability to see both binding and release phases in one run gives a full kinetic profile.
Sample volumes are small, at 50-200 microL per run. According to NCBI PMC (2022), real-time kinetics and label-free detection make SPR a primary tool in peptide interaction studies.
Can SPR be used for small molecule-peptide interactions?
Yes, SPR detects small molecule binding to immobilized peptide targets. The instrument tracks mass changes, so small analytes on larger peptides produce a measurable signal shift. Chip ligand density must be high enough for a clear signal-to-noise ratio.
This makes SPR useful in early-stage screening where analyte size varies widely. Researchers should verify that ligand density is correct before running small molecule experiments on peptide surfaces.
What is a sensorgram in SPR analysis?
A sensorgram is a graph that plots RU on the vertical axis and time on the horizontal axis. It records the binding event from the moment the analyte is added until the release phase ends. The curve shows a rise during binding and a decay during release.
Researchers use this record to check data quality and spot artifacts. It also helps calculate the kinetic rate constants of each peptide-target binding event.
Summary
SPR is a label-free optical method for studying peptide binding kinetics in real time. It produces three core outputs: ka, kd, and KD. Each comes from fitting sensorgram data to the 1:1 Langmuir model.
Proper chip setup, reference channel subtraction, and global fitting are all needed for valid results. Next Level Pharm provides HPLC-tested and mass spec-tested peptides at 99.4% average purity, supporting reproducible SPR assay runs from the first injection cycle.
What Should You Do Next?
Researchers planning SPR studies should confirm the purity specification of each peptide before chip attachment. A purity below 99% introduces co-attachment risk, which raises the non-specific binding baseline. COA-verified, lot-numbered materials keep assay results consistent across runs.
Browse the full catalog of HPLC-verified research peptides at the Next Level Pharm shop to source materials for SPR binding studies. Every vial ships with a COA and lot traceability data.
People Also Read
- Isothermal Titration Calorimetry Peptide Research
- FOXO Pathway Peptide Research for Longevity Studies
About the Author
Next Level Pharm Research Team
The Next Level Pharm research team is composed of biochemists and laboratory scientists dedicated to providing researchers with the highest-purity, lab-tested peptide compounds available. Every batch is HPLC and mass spec verified before dispatch.
Disclaimer: The information provided on this page is for educational and research purposes only. Next Level Pharm products are intended for laboratory research use only. They are not intended for human consumption, diagnostic, therapeutic, or medicinal purposes. This content does not constitute medical advice. Always consult a licensed healthcare professional before making any health-related decisions.