
How to Read an HPLC Chromatogram for Peptides

Last updated: July 2026
An HPLC chromatogram is a graph that shows the output of a High-Performance Liquid Chromatography (HPLC) analysis. It plots detector response against time. A sample passes through a separation column, and the detector records a signal as each compound exits. Each peak on the graph represents a compound in the sample. The area under each peak is used to calculate purity. According to Journal of Peptide Science (2018), HPLC chromatogram analysis is the standard method for purity assessment of synthetic peptides.
Next Level Pharm runs HPLC on every research peptide batch. Average purity holds at 99.4% across the last 100 batches. The HPLC chromatogram and area-percent purity are included on the COA for each lot.
Reading a chromatogram correctly helps researchers interpret the purity data on a COA. It also helps identify potential red flags before starting an assay. The sections below explain the key features of a chromatogram and how to read them.
Key Takeaways
- Axes: The x-axis shows retention time (how long each compound takes to exit the column). The y-axis shows detector response, which reflects the concentration of each compound at that moment.
- Main Peak: The largest peak is the target peptide. Its area relative to all peaks gives the purity percentage.
- Satellite Peaks: Smaller peaks represent impurities, degradation products, or synthesis byproducts. A clean chromatogram has a single dominant peak with a flat baseline.
- Area Percent Purity: Purity is calculated as the area of the main peak divided by the total area of all peaks, multiplied by 100.
- Retention Time: Each compound has a fixed retention time under set conditions. Matching the peak to a reference standard confirms the peptide’s identity.
The sections below cover each of these points. They explain what to look for on a chromatogram and how the data connects to the COA purity figure.
What Does an HPLC Chromatogram Show?
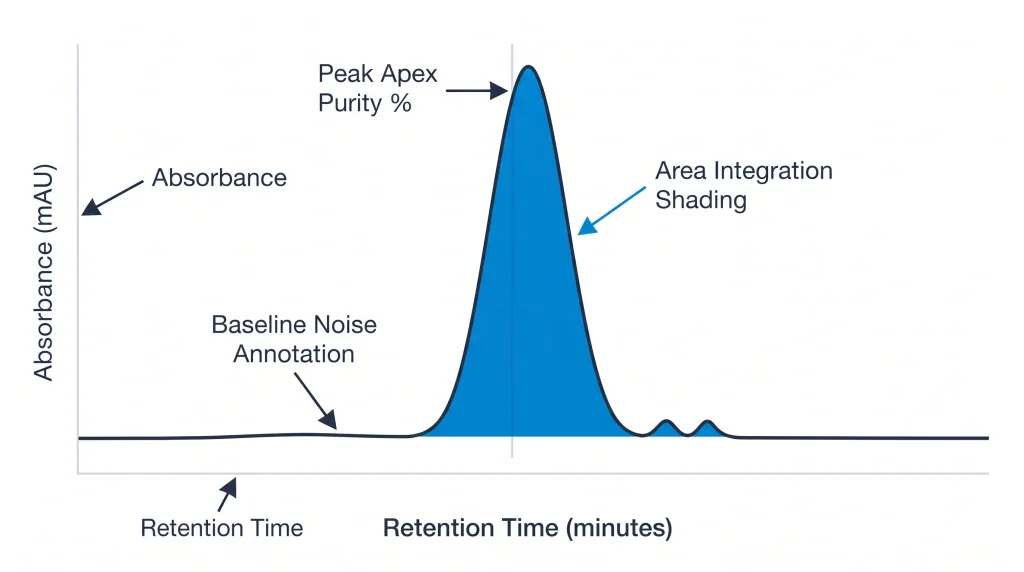
An HPLC chromatogram is a two-axis plot. The x-axis records time in minutes. This is called retention time (RT). The y-axis records the detector response in milli-absorbance units (mAU). Each compound in the sample produces a peak at its specific retention time.
The height and width of a peak depend on how much of that compound is in the sample. A large, narrow peak indicates a high amount of a single compound with good separation. Multiple small peaks across the baseline indicate impurities or degradation products. The chromatogram is the primary visual tool for assessing sample composition. It shows what is in the sample before the final purity figure is calculated.
BPC-157 HPLC chromatograms are provided on the COA for every lot, showing the main peak and any detectable satellite peaks.
What Does the Main Peak Represent?
The main peak is the largest signal on the chromatogram. It represents the target peptide as it passes through the detector at its retention time. Researchers confirm this is the correct peptide by comparing its retention time to a certified reference standard. Both must be run under the same conditions.
An ideal main peak is sharp, symmetrical, and clearly separated from adjacent peaks. This bell-curve shape indicates good column separation. It also suggests the sample has high purity. A peak with tailing (a longer right edge) suggests column interaction issues. It may also indicate peak overlap. A peak with fronting (a longer left edge) may indicate column overload. Some asymmetry is normal in synthetic peptides and does not always indicate a quality problem.
What Do Shoulder and Satellite Peaks Indicate?
Satellite peaks are small, distinct signals that appear alongside or separate from the main peak. They represent other compounds in the sample: impurities, synthesis byproducts, or degradation products. Shoulder peaks are distortions on the edge of the main peak. They indicate a closely related compound that the column did not fully resolve.
The number and size of satellite peaks affect the purity percentage. Each satellite peak’s area reduces the main peak’s contribution to the total. A clean, high-purity sample has very few and very small satellite peaks. A sample with many satellite peaks, or with shoulders, may need additional purification before use. The baseline between peaks should be flat and low.
How Is Area Percent Purity Calculated?
Area percent purity is calculated from two values: the area of the main peak and the total area of all peaks. The first is divided by the second and multiplied by 100. This is the standard purity metric on a COA for research peptides.
The calculation is performed by data integration software. The software fits a curve to each peak and calculates the area under it. It then sums all peak areas and computes the percentage for each. The main peak’s percentage is the reported purity value. A value of 99% means that 99% of the total detected signal comes from the target compound. According to NCBI (2020), this area-percent method is the standard approach for synthetic peptide purity reporting in research settings.
Tirzepatide purity is measured by area percent HPLC on every lot and reported on the COA.
What Does Retention Time Tell a Researcher?
Retention time (RT) is the time from sample injection to when a compound’s peak reaches the detector. It is measured in minutes. Each compound has a fixed RT under a given set of conditions. These include column type, mobile phase, temperature, and flow rate.
RT acts as a fingerprint for a compound. A researcher matches the sample’s main peak RT to that of a certified reference standard. If the RTs match under identical conditions, the peak is confirmed as the target peptide. If the RT shifts, it may indicate a different compound or a column condition change. This is why reference standards are run alongside test samples in routine analysis.
How Does HPLC Compare to LC-MS for Peptide Testing?
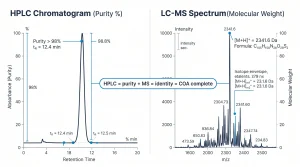
HPLC alone can confirm purity but not molecular identity. LC-MS (HPLC paired with mass spectrometry) adds identity confirmation. The mass spectrometer measures the mass-to-charge ratio (m/z) of each compound. It takes this reading as each compound exits the HPLC column. This confirms whether the main peak is the correct peptide or a co-eluting impurity.
The table below shows what each method proves and what it misses.
| Parameter | HPLC only | LC-MS |
| Separates components | Yes | Yes |
| Measures purity % | Yes | Yes |
| Confirms molecular weight | No | Yes |
| Identifies co-eluting compounds | No | Yes |
| Maps amino acid sequence | No | Yes (with MS/MS) |
| Required for COA | Yes (purity) | Yes (full profile) |
HPLC-UV alone can misidentify a compound if a contaminant shares the same retention time. LC-MS resolves this by checking both RT and molecular weight. At Next Level Pharm, dual HPLC and mass spec data appear on every COA. Browse COA-verified research peptides with full lot-specific test data.
Frequently Asked Questions
What does an HPLC chromatogram show?
A chromatogram is a plot of detector response over time. The sample moves through the HPLC column, and the detector records a signal as each compound passes. The x-axis shows retention time; the y-axis shows detector response. Each peak represents a compound in the sample. The size and position of each peak reflect the amount and identity of that compound. The chromatogram is used to identify the target peptide. It also gives the purity value relative to all detected components.
What does the main peak represent?
The main peak is the largest signal on the chromatogram. It represents the target peptide at its specific retention time. Researchers confirm it is the correct compound by comparing its retention time to a certified reference standard. The area under this peak, divided by the total area of all peaks, gives the purity percentage. An ideal main peak is sharp and symmetrical with minimal shoulder or adjacent peaks.
What do shoulder and satellite peaks indicate?
Satellite peaks are separate small signals from impurities or synthesis byproducts. Shoulder peaks are distortions on the edge of the main peak from closely related compounds the column did not fully separate. Both types of peaks reduce the main peak’s area-percent share. According to Journal of Peptide Science (2018), shoulder peaks can indicate that more purification is needed. This applies before any research use.
How is area percent purity calculated?
Area percent purity is the area under the main peak divided by the total area of all peaks, multiplied by 100. Data integration software calculates this by fitting a curve to each peak and summing the areas. The main peak percentage is the purity value on the COA. A 99% result means 99% of the detected signal comes from the target compound. This is the standard purity metric for research-grade synthetic peptides.
What does retention time tell a researcher?
Retention time (RT) is the time from injection to when a compound’s peak appears at the detector. It is specific to each compound under a fixed set of conditions. Matching the sample’s main peak RT to a reference standard’s RT confirms the peptide’s identity. The reference must run under the same conditions. A RT shift from the reference may indicate a different compound or a change in column conditions. RT is used as a chemical fingerprint alongside mass spec confirmation.
Can HPLC differentiate between similar peptides?
HPLC has limits when two peptides share similar chemical properties and elute at the same time. This is called co-elution. It causes two distinct compounds to appear as one peak. HPLC alone cannot resolve co-eluting peptides at the molecular level. Mass spectrometry is needed to confirm the molecular weight and distinguish the correct sequence from a co-eluting impurity. This is why dual testing is standard.
Why is a reference standard important for HPLC?
A reference standard is a known, high-purity sample of the target peptide. It is run on the HPLC under the same conditions as the test sample. The reference shows where the correct compound elutes (its RT) and how large its peak should be. Comparing the test sample to the reference confirms the identity of the main peak. Without a reference, the peak identity can only be inferred from retention time alone.
What does research grade mean for peptide purity?
Research grade means the peptide has been analytically verified to meet defined purity thresholds. For synthetic peptides, this typically means 98% or higher HPLC area-percent purity. Next Level Pharm holds a minimum of 99% purity. The average across the last 100 batches is 99.4%. Both HPLC and mass spec data appear on the COA for every lot. This dual verification is the standard for research-grade quality documentation.
What is the difference between HPLC and LC-MS?
HPLC separates components and measures purity by area percent. LC-MS adds a mass spectrometer as the detector, measuring the molecular weight of each compound as it elutes. HPLC shows how pure the sample is. LC-MS shows both purity and whether the compound is the correct molecule. LC-MS is the standard for full identity and purity confirmation in research peptide testing.
Why is 99%+ purity the standard for research peptides?
Higher purity reduces the chance that assay results are affected by impurities rather than the target compound. At 99%+ purity, the contribution of impurities to any observed signal is minimal. Lower purity samples may produce confounded results if impurities interact with the assay system. A 99.4% purity average means less than 0.6% of the detectable signal comes from non-target material. That is a very low level of interference. This level is standard for quantitative or mechanistic peptide research.
Summary
An HPLC chromatogram plots detector response against time to show the composition of a peptide sample. The main peak represents the target compound. Its area percent relative to all peaks is the purity value. Satellite and shoulder peaks indicate impurities. Retention time identifies the compound by comparison to a reference standard. LC-MS extends HPLC by confirming molecular weight alongside purity.
What Should You Do Next?
When reviewing a COA, locate the HPLC chromatogram. Check for a single dominant main peak with minimal satellite peaks. Confirm the area-percent purity is 99% or above. Check the retention time matches the reference for that peptide. If mass spec data is present, verify the m/z matches the theoretical value. Browse COA-verified research peptides at Next Level Pharm with HPLC and mass spec data on every lot.
People Also Read
- What Makes a Peptide Research Grade? Standards and Testing Explained
- BPC-157 Mechanism of Action: What Research Shows
About the Author
Next Level Pharm Research Team
The Next Level Pharm research team is composed of biochemists and laboratory scientists dedicated to providing researchers with the highest-purity, COA-verified research peptides available. Every batch is HPLC and mass spec verified before dispatch.
Disclaimer: The information provided on this page is for educational and research purposes only. Next Level Pharm’s products are intended for laboratory research use only. They are not intended for human consumption, diagnostic, therapeutic, or medicinal purposes. This content does not constitute medical advice. Always consult a licensed healthcare professional before making any health-related decisions.